The new Performance Insights panel in Chrome Dev Tools
A recent release of Chrome, version 102.x, now includes a handy Performance insights panel which can be found in the dev tools. This is, however, an experimental feature that will be evolved based on the feedback received from the users.
Now, this panel is useful in auditing performance bottlenecks such as tracking down render-blocking requests, long tasks, layout shifts, and so on. The tool lists all these issues through a nice timeline that can easily be gone through.
To get started, open the dev tools (Press Ctrl/Cmd + Shift + I) and then click on the “Performance insights” tab that looks like so.
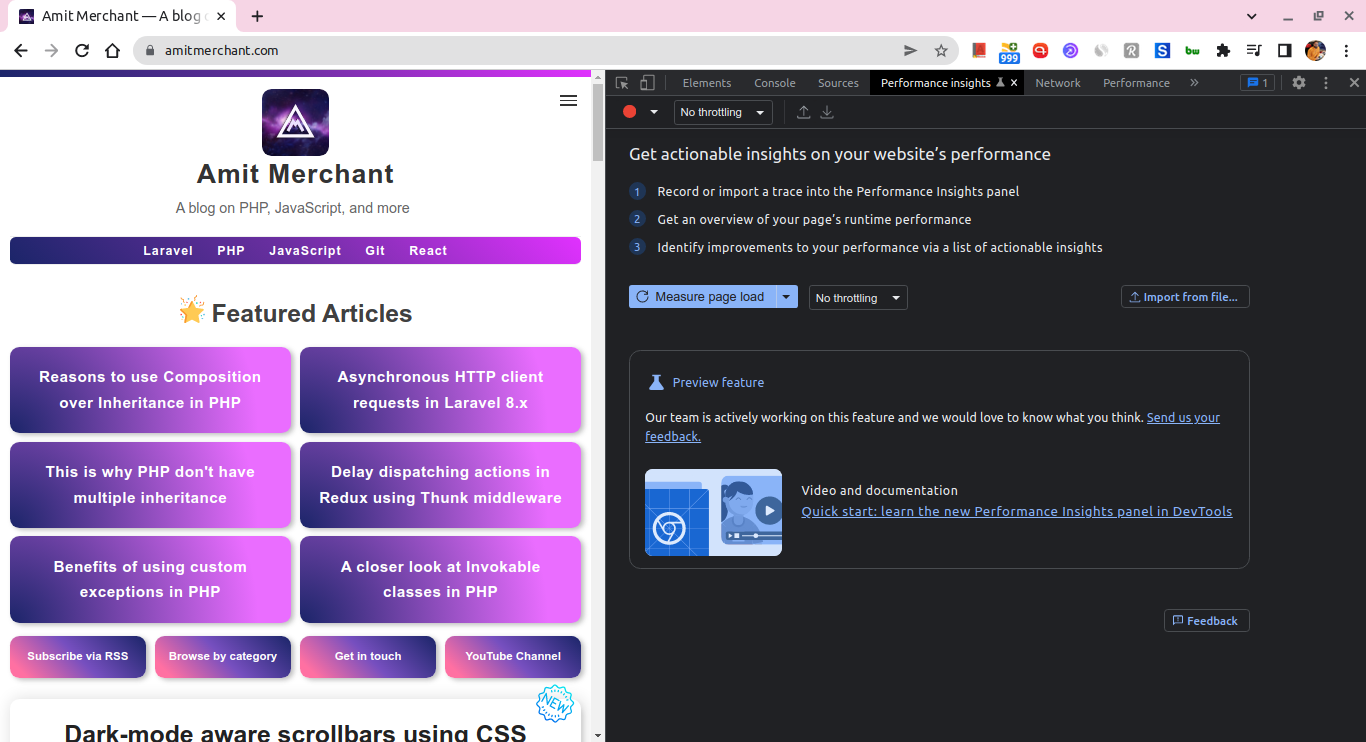
From here, you can start auditing the performance of the website by hitting the “Measure page load” button.
It will take its time to gather all the insights and then present a horizontal timeline of how things like JS, CSS, font, and images have been loaded periodically and through this, you’ll be able to figure out potential issues.
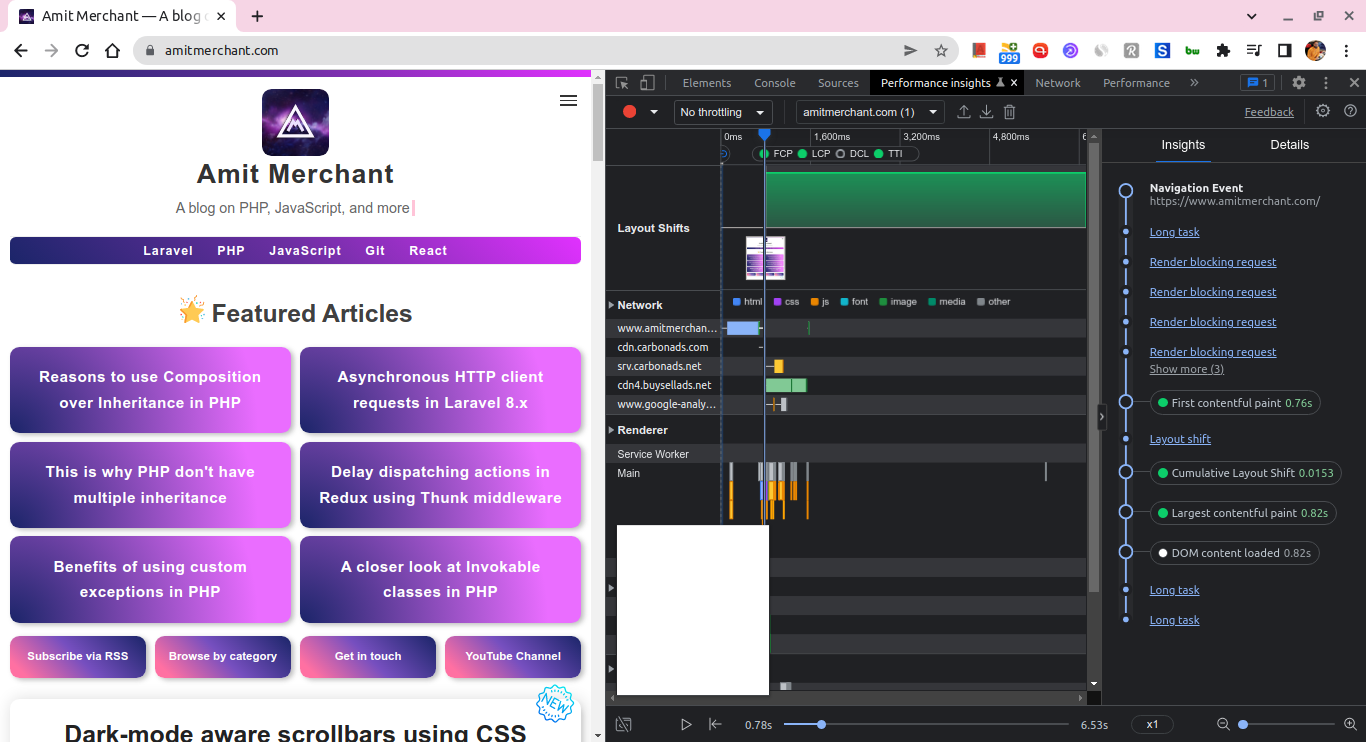
But the cool part here is the “Insights” panel which is there on the far right of the panel. It shows the events such as render-blocking requests, long tasks, layout shifts, and so on as a vertical timeline in the order of their occurrence.
Clicking on one of these events would navigate you to the “Details” tab which gives the details about the potential cause of it and the elements affected by it like so.
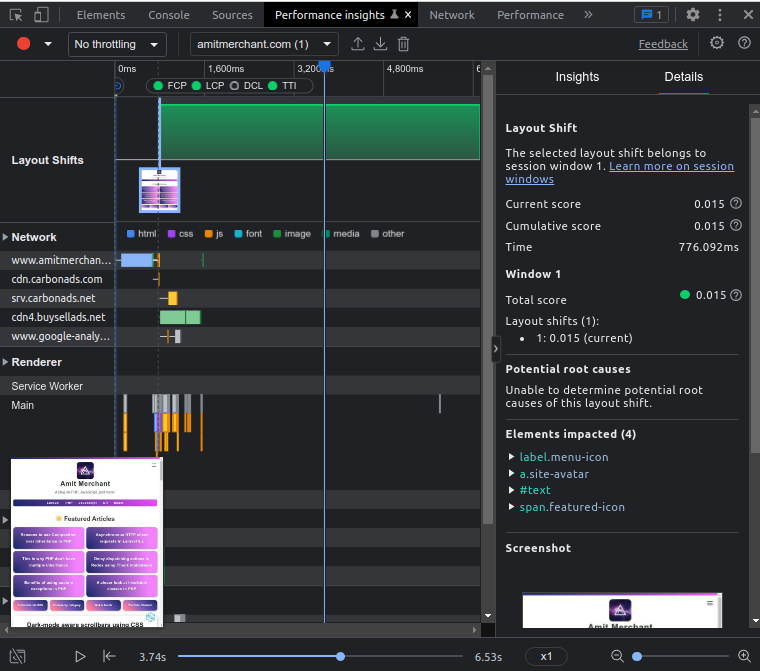
This detail can be useful in mitigating the potential issues of your website.
And since this feature is still experimental, you can give your feedback to them so that, it can be improved further.

👋 Hi there! This is Amit, again. I write articles about all things web development. If you enjoy my work (the articles, the open-source projects, my general demeanour... anything really), consider leaving a tip & supporting the site. Your support is incredibly appreciated!